Statistical Performance Leaders on the PGA Tour
By: Golfshake Editor | Mon 20 Aug 2018
Share this article:
![]()
![]()
![]()
Incredibly, the regular PGA Tour season has been completed, and the FedEx Cup Playoffs are under way. It began in October with Safeway Open in California, and 43 events later, the top 125 on the points standings have progressed to compete in the lucrative final series of elite tournaments.
Looking at the PGA Tour's Records, players have averaged 21 appearances on the circuit this year, which is a strong sampling for statistics. Breaking down player performance can be done by looking at the money list or number of victories and high finishes, but you can delve a bit deeper into the statistical cateogries that track the stats of each golfer on the tour.
From the more traditional stats like Driving Distance and Greens in Regulation to the influential Strokes Gained, players and their support teams and coaches will analyse these numbers to identify strengths and weaknesses. Areas in which they can improve. Likewise with the Golfshake Score Tracker, we have found that tracking stats can be hugely beneficial to the games of regular golfers, something that you can take full advantage of, including the ability to benchmark your performance across 14 key stats.
Featured Content
Importance of Stat Tracking to Improve Your Game
Round Recorder on Course Stat Tracker
Golfshake App for iPhone and Android
We have taken a look at the main categories on the PGA Tour this season and identified the players who are leading the way.
(Information Correct on 20th August 2018)
Scoring Average
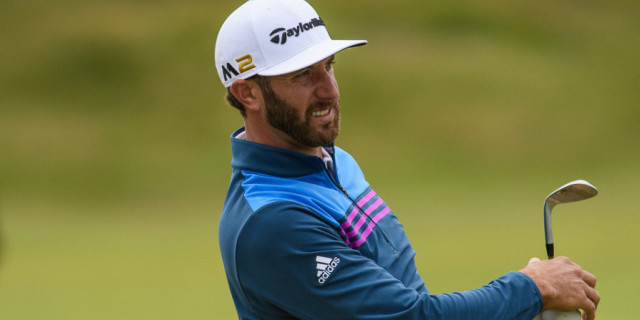
1. Dustin Johnson: 68.597
2. Justin Rose: 69.020
3. Justin Thomas: 69.116
4. Webb Simpson: 69.249
5. Tommy Fleetwood: 69.351
Driving Distance
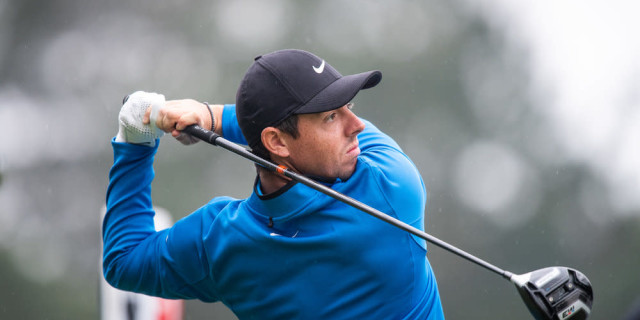
1. Rory McIlroy: 320.5
2. Trey Mullinax: 320.2
3. Tony Finau: 316.9
4. Luke List: 316.3
5. Tom Lovelady: 315.9
Driving Accuracy Percentage
1. Ken Duke: 77.98
2. Henrik Stenson: 74.11
3. Ryan Armour: 72.80
4. Ryan Moore: 71.88
5. Kyle Stanley: 71.15
Greens in Regulation Percentage
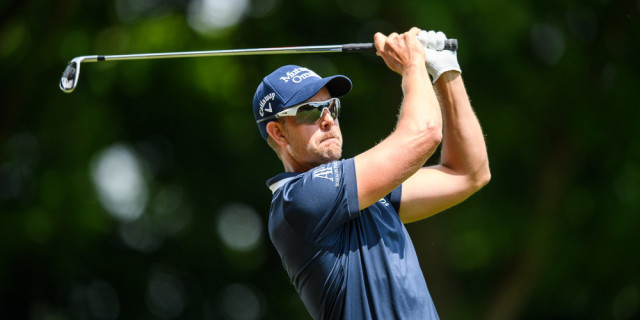
1. Henrik Stenson: 73.48
2. Joaquin Niemann: 72.98
3. Sam Ryder: 72.30
4. Kevin Streelman: 72.09
5. Gary Woodland: 71.21
Scrambling Percentage
1. Rory McIlroy: 66.34
2. Louis Oosthuizen: 66.26
3. Webb Simpson: 66.19
4. Ryan Moore: 65.50
5. Johnson Wagner: 65.41
Strokes Gained: Tee-to-Green
1. Dustin Johnson: 2.102
2. Justin Thomas: 1.710
3. Francesco Molinari: 1.670
4. Henrik Stenson: 1.627
5. Luke List: 1.507
Strokes Gained: Putting
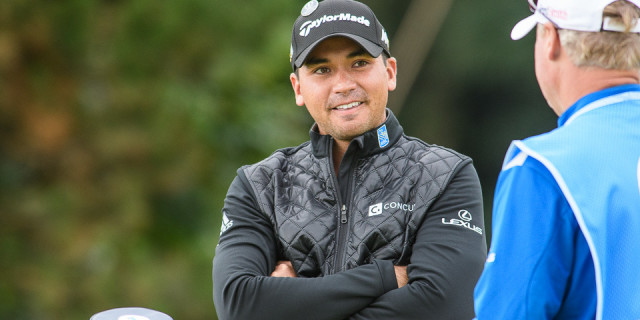
1. Jason Day: .976
2. Phil Mickelson: .853
3. Greg Chalmers: .790
4. Daniel Summerhays: .736
5. Alex Noren: .687
Strokes Gained: Total
1. Dustin Johnson: 2.607
2. Justin Rose: 2.038
3. Justin Thomas: 2.026
4. Jason Day: 1.950
5. Tiger Woods: 1.735

Be part of the action with a selection of unique golf tournament experiences, from playing in a pro-am with the stars to watching the action at golf’s most illustrious events. Whether it’s the Masters or The Open, The Ryder Cup or WM Phoenix Open, build your own bespoke package with the experts at Golfbreaks.com.